OVERVIEW
This machine energy efficiency case study features a battery recycling manufacturer in Singapore operating energy-intensive equipment. The manufacturer wanted better visibility into machine energy consumption and efficiency, especially for crasher machines used in the recycling production flow.
While power and production data were available, there was no consolidated platform to analyse energy consumption together with production output, making it difficult to spot hidden waste.
To bridge this gap, Lim Kim Hai Electric deployed the E2MAS (Energy Efficiency Monitoring and Analytics System) for a 3-month proof-of-concept on 3 crasher machines to reduce waste and optimise machine performance.
At a Glance
-
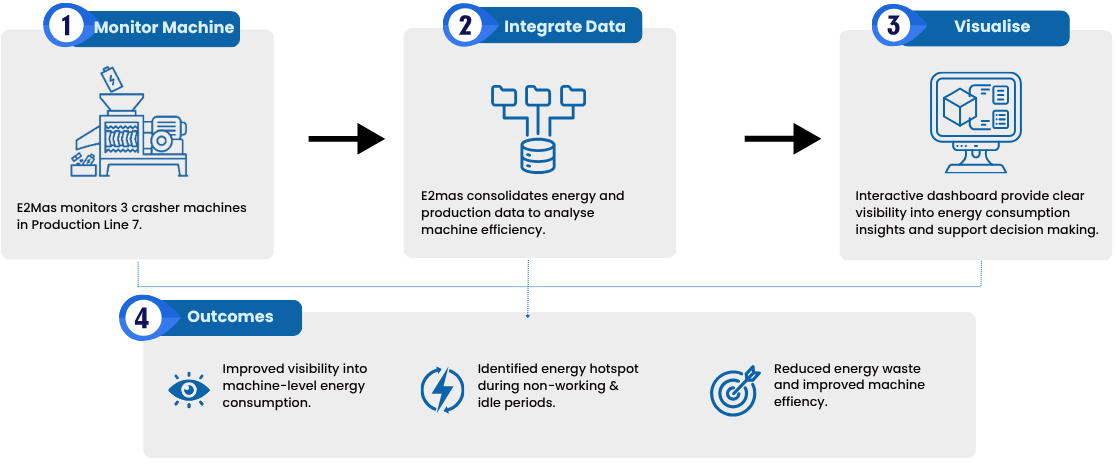
Monitored and analysed 3 critical crasher machines in Production Line 7
-
Improved visibility into machine-level energy consumption
-
Identified energy waste during non-working and idle periods
-
Combined energy and production data for efficiency analysis
-
Enabled data-driven operational and energy management decisions
Customer Background
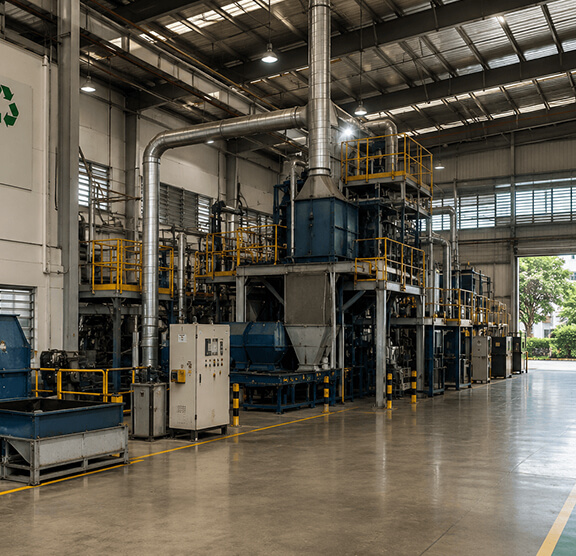
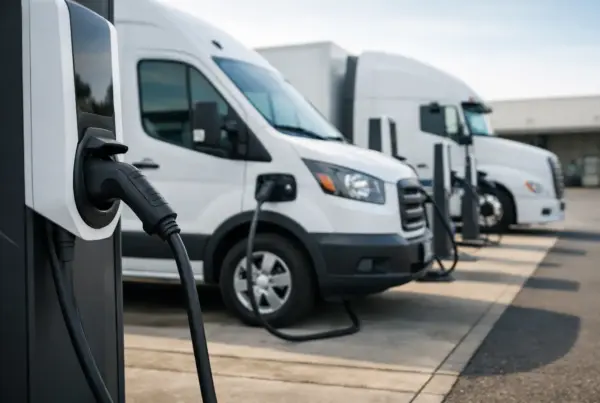
(Photos for illustration purpose only)
A battery recycling manufacturer with multiple mechanical production processes. Their operation involves high-energy equipment such as crasher machines, which are critical to the recycling production flow.
Due to long operating hours, the factory’s production equipment contributes to high overall electricity consumption. Although power data and production records were available, these data sources were reviewed separately.
Without a single platform to analyse machine-level energy usage together with production output, it was difficult to identify inefficiencies and improve machine energy efficiency.
The Challenge: Machine Energy Efficiency in Crasher Machine Operations
The battery recycling manufacturer faced several operational and energy management challenges that limited visibility into machine efficiency and energy performance. Before the deployment of E2MAS, the company faced several operational limitations:

1. Limited Machine-Level Energy Visibility
There was limited visibility into how individual crasher machines consumed energy during production, standby, and non-working hours.

2. Energy and Production Data Were Separate
Power consumption data was not analysed together with production output, making it difficult to measure machine efficiency.

3. Hidden Energy Waste
Some machines continued consuming power during idle periodicals and outside operating hours, resulting in unnoticed energy waste.

4. No Centralised Energy Monitoring Platform
A single platform was needed for the customer to collect, view and analyse energy and production data.
The customer wanted to understand👉
- Which crasher machines were consuming the most energy?
- Whether energy consumption matched actual production output.
- Whether machines were consuming power during non-working hours.
- How current energy performance compared with previous operating patterns?
- Where energy waste could be reduced through better machine scheduling and operation control?
- How energy consumption contributed to carbon footprint?
The key challenge was turning raw power and production data into meaningful insights. The manufacturer needed greater visibility into machine energy performance, energy waste, production efficiency, and carbon footprint to support better operational decision-making.
The Solution: Improving Machine Energy Efficiency with E2MAS
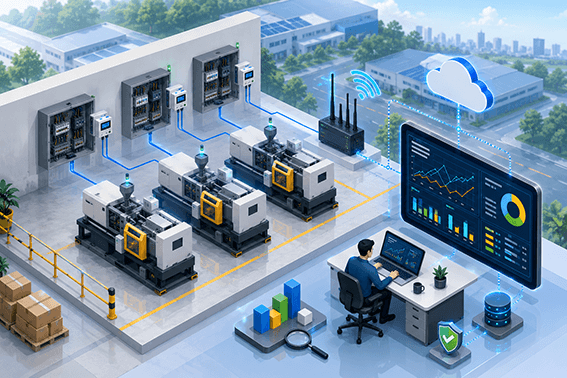
To address these needs, E2MAS was introduced to provide real-time visibility into machine energy performance. The system architecture followed a simple but effective workflow:
System Architecture
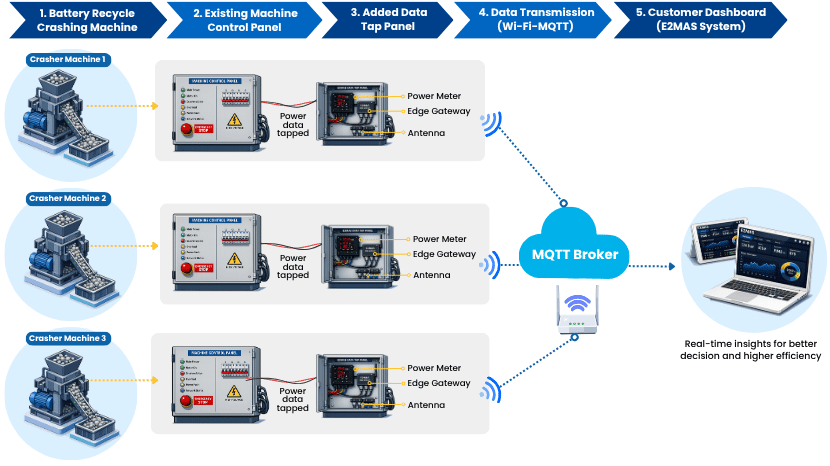
- E2MAS connected machine-level power meters to a data gateway, enabling crasher machine energy data to be transmitted through MQTT.
- Production data could also be uploaded via Excel or CSV files.
- This allowed the customer to analyse machine energy efficiency through dashboards, benchmarking, and energy performance insights.
How E2MAS Turned Data into Insights
The E2MAS solution provided a simple, step-by-step workflow that turned messy numbers into clear, useful facts for the business:
STEP 1: Turning raw power data into useful insight

Instead of looking at confusing rows of numbers, E2MAS turned raw machine energy data into simple, visual charts on a single dashboard. This made it easy to spot energy hotspots—the exact times and areas where a crasher machine was consuming the most power.
Step 2: Connecting Machine Energy to Actual Factory Output
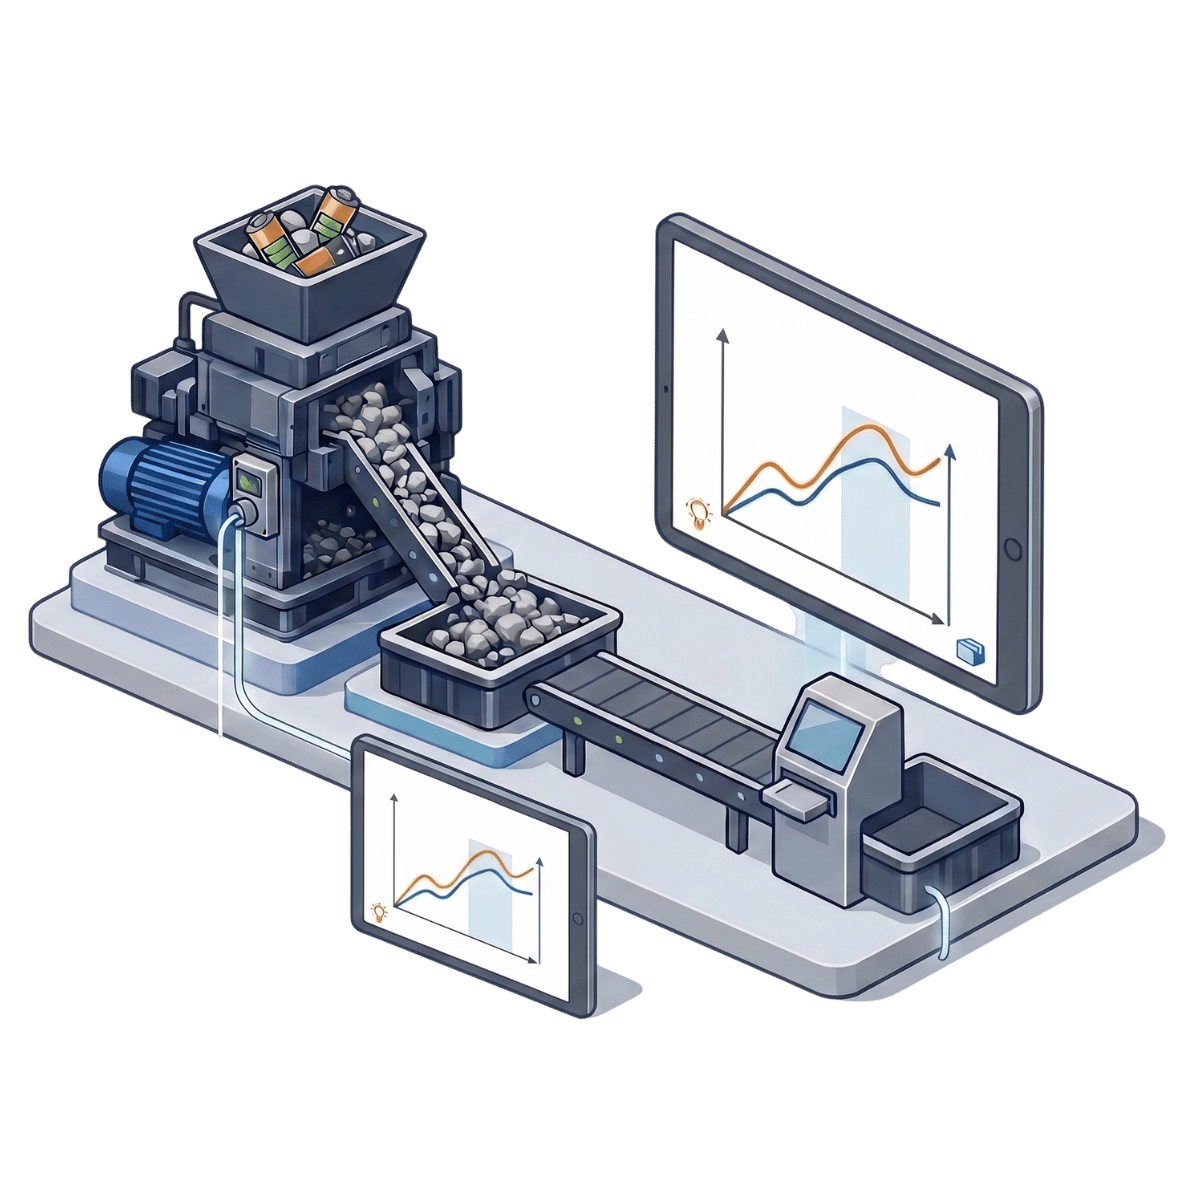
The system matched machine energy data directly with the factory’s production records. Instead of just tracking total electricity used, managers could see if high machine energy consumption was actually justified by the amount of product being made.
Step 3: Catching Hidden Waste and Taking Quick Action
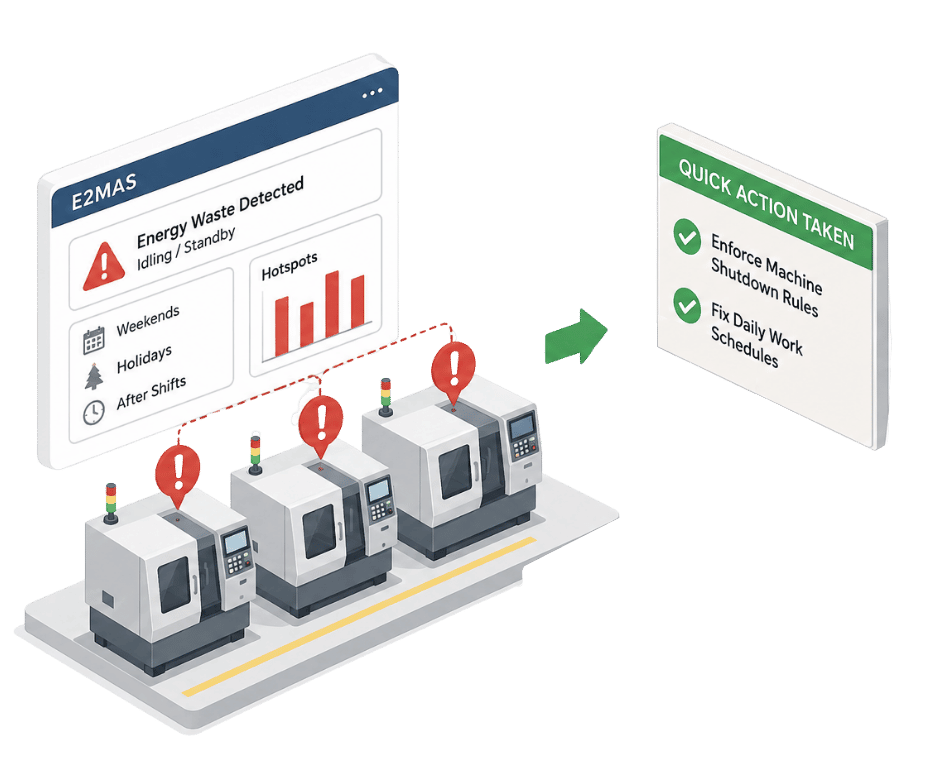
E2MAS flagged machines that were wasting energy by idling or staying on standby during weekends, holidays, or after shifts ended. Armed with proof of these hotspots, the customer took quick action by enforcing strict machine shutdown rules and fixing daily work schedules.
Step 4: Tracking Savings and Planning Next Steps

E2mas compared current machine energy use against the factory’s best, most efficient days from the past to prove that the changes were lowering the power bill. Testing this successfully on just three machines gives the company a proven blueprint to easily roll out the system across the rest of the factory.
What Was Delivered
Site Assessment
Reviewed crasher machine monitoring requirements and available data collection methods for three machines in Production Line 7.
Power Monitoring Setup
Installed digital power meters and integrated them with the electrical panels to capture machine-level energy consumption.
Data Gateway and Communication
Configured data gateways and MQTT communication to transmit power data from the machines to the E2MAS platform.
E2MAS Platform Deployment
Set up the E2MAS system on a local monitoring laptop for centralised energy monitoring, dashboard viewing, and analysis.
Dashboard and Data Integration
Configured machine-level dashboards and integrated production data to analyse energy consumption against actual production output.
Energy Performance Analysis
Analysed machine utilisation, idle-period consumption, energy efficiency, and improvement opportunities to identify hidden energy waste
Results and Business Impact
The E2MAS deployment helped the customer move from basic power monitoring to proactive energy performance management. By combining energy data with production information, the manufacturer gained a much clearer understanding of machine efficiency and operational behaviour.
Metric
Before E2MAS
After E2MAS
Machine-level energy visibility
Energy and production analysis
Non-working hour energy waste
Performance comparison
Future expansion
| Metric | Before E2MAS | After E2MAS |
| Machine-level energy visibility | Limited visibility by individual machine | Energy usage tracked across 3 crasher machines |
| Energy and production analysis | Reviewed separately | Combined for machine efficiency analysis |
| Non-working hour energy waste | Difficult to detect | Idle and standby consumption became visible |
| Performance comparison | No clear benchmark | Current usage can be compared with past operating patterns |
| Future expansion | No proven setup | 3-month POC created a foundation for phase 2 |
Key Outcomes
The project helped the customer move from basic power monitoring to practical energy performance management. By combining energy consumption with production data, E2MAS gave the customer clearer visibility into crasher machine efficiency, identified energy use during non-working hours, and highlighted energy-saving opportunities that were previously difficult to detect through manual observation alone.
With these insights, the customer could take actions such as improving machine schedule checking and reducing unnecessary standby or idle operation. This supports Singapore’s wider push towards energy efficiency and sustainable industrial operations.
Enquire Now
Want better visibility into machine energy use?
Find out how E2MAS can help identify hidden energy waste and improve operational efficiency. Submit the form below and our team will get in touch.